01 — Foundation
Why we build dashboards ourselves
For us, a dashboard is not a pile of widgets in a template tool but a small web app: a backend that pulls and aggregates data from your sources, and a frontend that shows exactly the views you actually open in the morning. We have been building analytics since Google Analytics existed, and in that time we have watched enough reporting tools come and go to know: the tool is replaceable, the data architecture behind it is not. What the data side looks like is covered on our Tracking & Analytics overview.
02 — Honest
Where Looker Studio ends
Looker Studio is perfectly fine to start with, and we use it ourselves when it is enough. It ends exactly where things get interesting: connectors only deliver the fields the vendor provides, many third-party connectors cost extra every month, and calculations across multiple sources quickly become sluggish or impossible. As soon as a metric does not fit the given schema, say a contribution margin built from revenue, purchase prices and ad costs across three platforms, that is the end of the road. Add load times that easily reach double-digit seconds with several sources.
A reporting tool shows what the connector gives you. Your own dashboard shows what you want to know.
03 — Engineering
Direct connection to shop, ads and CRM
Our dashboards fetch data where it originates: via API from Shopify or WooCommerce, from the ad accounts of Google, Meta and TikTok, from the CRM, and where needed from the BigQuery export we describe on the GA4 page. The raw data lands in a small database of its own, gets merged cleanly once, and is then available to every view. No connector fees, no third-party limits, and when a new source comes along, we wire it in.
04 — Built in-house
Metrics no standard tool has
The real reason for building your own is the metrics. Contribution margin per order instead of just revenue. Cohorts by first-purchase month, to see whether new customers come back. VIP segments with their own revenue share and AOV comparison. Two examples from real setups:
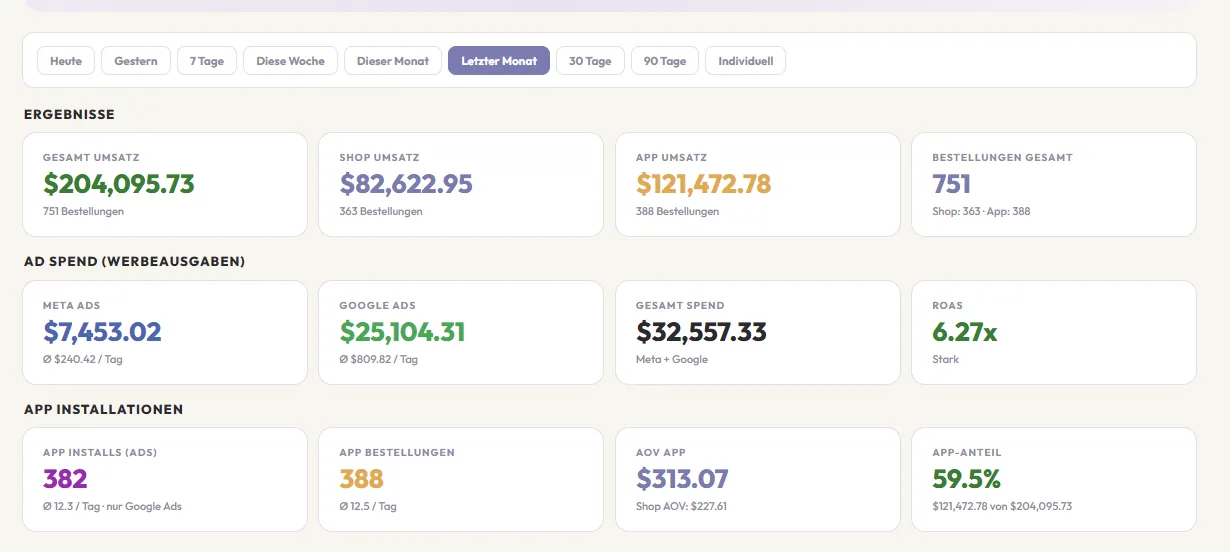
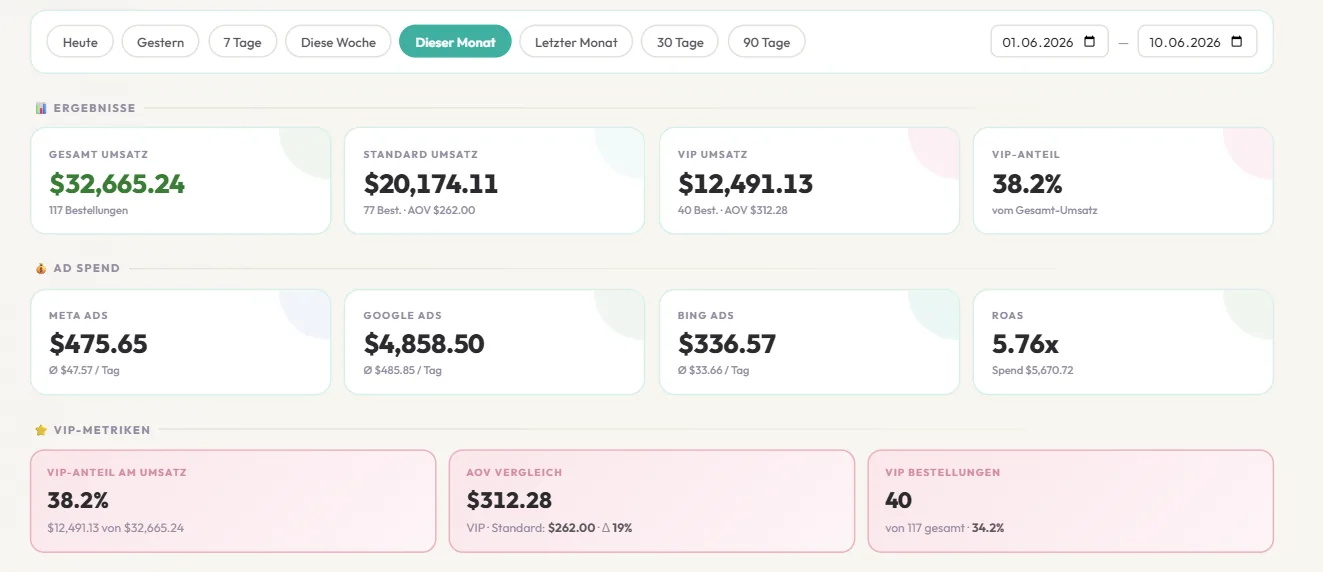
If there is a number in your head that no tool shows you: that is exactly what these boards are for. Write to us below and tell us which one, and we will sketch out how to get there, no strings attached.
05 — Operations
Load time, operations and alerts
A dashboard nobody opens because it takes ten seconds to load is worthless. So we pre-aggregate: queries run overnight or hourly in the background, and the view itself loads in under a second. Operations are part of the package: hosting, API keys, monitoring of the data sources and an alarm when a source stops delivering. And because nobody stares at boards all day, we build in alerts that speak up when numbers tip, say via email or Slack when ROAS drops below a threshold. The data quality underneath is secured by the measurement pipeline we describe under server-side tracking.
06 — Scope
We build the board. And who reads the numbers?
This page deliberately covers the build only: architecture, integration, metrics, operations. Interpreting the numbers, meaning what the cohort dip means and where the budget goes next, is a discipline of its own with its own rhythm.
There is a dedicated page for that: how we turn the numbers into recommendations and budget decisions is covered in reporting in performance marketing. Both from one team means no translation loss between board and budget.
Which number is missing from your mornings?
Tell us briefly which sources you have (shop, ads, CRM) and which metric you want to see but can't find anywhere. We will tell you honestly whether that needs a custom board or whether a simpler setup will do. First call free, 30 minutes.